
Using Service Discovery to overcome the laziness inherent to all sysadmins.
Prometheus is time series database use for metrics and alerting. Coupled with Grafana it’s my go-to solution for instrumenting metrics for Linux/Windows/SNMP devices.
However, as we move further into a world of short-lived/ephemeral horizontal scaling, it’s important that we have a simple and robust way to monitor system load. Enter Service Discovery.
Service Discovery #
The conventional approach to configuring systems such as Prometheus is to maintain a config file of individual systems, manually updating the config every time a new system is launched or retired. Apart from being tedious, this method relies on human interaction.
Since AWS already knows everything about all your services, it’s trivial to configure Prometheus to talk to AWS and dynamically query the list of EC2 instances.
Take this configuration snippet from /etc/prometheus/prometheus.yml
...
  - job_name: 'node-exporter'
    scrape_interval: 15s

    ec2_sd_configs:
    - region: ap-southeast-2
      port: 9100
      access_key: "your-access-key"
      secret_key: "your-secret-access-key"

    static_configs:
    - ....
As hinted at via the static_configs directive at the bottom, this sits in inside an existing static configuration; on-prem/non-discoverable servers are listed here.
Noting the ec2_sd_configs directive; we query a region via IAM access keys and secrets, and specify a port. The port references which port node_exporter is running on the target instances.
But this is only half the battle; when we load this into Grafana the EC2 instances are labelled as their IP address. This is completely useless in a world of short-lived instances and DHCP. To resolve this, we dive into the dark magic that is relabel_configs.
relabel_configs #
  - job_name: 'node-exporter'
    scrape_interval: 15s

    ec2_sd_configs:
    - region: ap-southeast-2
      port: 9100
      access_key: "your-access-key"
      secret_key: "your-secret-access-key"

    relabel_configs:

    - action: replace
      source_labels: [__meta_ec2_tag_Name, __meta_ec2_private_ip]
      separator: ':'
      regex: ([a-zA-Z0-9\-]+):((?:(?:25[0-5]|2[0-4][0-9]|[01]?[0-9][0-9]?)\.){3}(?:25[0-5]|2[0-4][0-9]|[01]?[0-9][0-9]?))
      target_label: instance
      replacement: $1:$2

    - action: replace
      source_labels: [__meta_ec2_tag_business]
      target_label: business
      regex: (\w+)
      replacement: $1

    - action: replace
      source_labels: [__meta_ec2_tag_stack, __meta_ec2_tag_environment]
      target_label: stack
      regex: (\w+)-(\w+)
      separator: '-'
      replacement: $1-$2

    - action: replace
      source_labels: [__meta_ec2_tag_role]
      target_label: role
      regex: (\w+)
      replacement: $1

    - action: replace
      source_labels: [__meta_ec2_tag_stability]
      target_label: stability
      regex: (\w+)
      replacement: $1

    static_configs:
    - ....
By updating the Prometheus job to include relabel_configs we can tell Prometheus to change how the instance appears within Grafana based on AWS tags.
What is all this jibberish? #
Let’s go over some key items in relabel_configs.
target_label: instance #
- action: replace
  source_labels: [__meta_ec2_tag_Name, __meta_ec2_private_ip]
  separator: ':'
  regex: ([a-zA-Z0-9\-]+):((?:(?:25[0-5]|2[0-4][0-9]|[01]?[0-9][0-9]?)\.){3}(?:25[0-5]|2[0-4][0-9]|[01]?[0-9][0-9]?))
  target_label: instance
  replacement: $1:$2
This will replace the target label instance with the contents of __meta_ec2_tag_Name and __meta_ec2_private_ip (concatenated with a colon). The regex option ensures that instance will only be updated if the new string matches the regex pattern; since the relabel_config will apply to every instance in this job (remember the static_configs instances mentioned earlier…?) it’s important we don’t replace a valid instance label with a blank string.
target_label: business #
- action: replace
  source_labels: [__meta_ec2_tag_business]
  target_label: business
  regex: (\w+)
  replacement: $1
This again will replace the target label business with teh contents of __meta_ec2_tag_business. Again, we run a regex match for any word to ensure we’re not replacing a valid string with an empty one.
This is particularly useful to filter EC2 instances by business entity.
target_label: stack #
- action: replace
  source_labels: [__meta_ec2_tag_stack, __meta_ec2_tag_environment]
  target_label: stack
  regex: (\w+)-(\w+)
  separator: '-'
  replacement: $1-$2
This again will replace the target label stack with the contents of __meta_ec2_tag_stack and __meta_ec2_tag_environment, concatenated with a colon. Once again we apply regex filtering to ensure that the we’re not replacing a valid string with an empty one.
This is used to filter EC2 instances by their application stack (e.g. CRM) and the stack’s environment (e.g. CRM-Alpha or CRM-Prod).
Gathering data #
So now that Prometheus knows about these instances we still need a way to extract data from them. This Prometheus job is configured to use node_exporter, so we need a way to get that installed onto the EC2 instances.
We can achieve this in two ways:
- Installation at launch time via the EC2 user data (preferred)
- Installation after launch via SSM, as I mentioned in my article on AWS Automation Wizardry
For now let’s focus on the second option - installing via SSM.
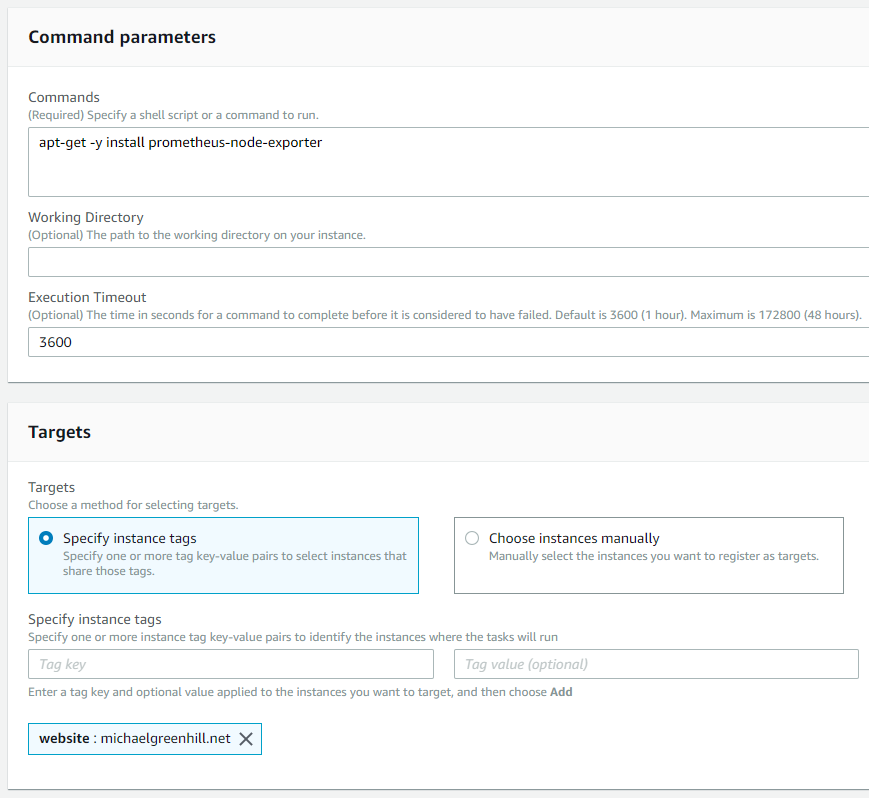
- Head to the AWS Console and go to AWS Systems Manager
- Go to Instances & Nodes and select Run Command
- Using the AWS-RunShellScript command document, enter your commands to install
node_exporter:# This assumes you're running Debian because you're a cool kid, right?
apt-get -y install prometheus-node-exporter - Select your instances either by tags, individually, or by resource group.
- Click the big ol’ Run button to continue.
NOTE: This assumes that your EC2 instances have been launched with an IAM Role and that the role has AmazonSSMServiceRolePolicy or equivalent permission policies attached. It also assumes you have SG exceptions allowing connections inbound to port TCP/9100, and a NACL that allows both inbound to TCP/9100 and outbound from TCP/9100 (remembering, of course, that NACL is not a stateful firewall).
That’s nice, but? #
My main motivation for writing this was the lack of information out there on the intertubes about Prometheus’ relabel_configs. I hope this will be of use to someone.